I actually pulled the climate data in my region not that long ago, as part of a discussion with my father. The data I had went back over a hundred years. The conclusion we came to is that it is getting slightly warmer over time, but far less than projected by the "Climate Scientists"
This is mostly because of an unusually cool period in the 50s and 60s. If you go back further it was really only a little warmer than it was in the early 30s. I'm wondering how much my data would fall in line with his.
The founding of Jamestown nearly ended in complete failure because of drought the likes of which have never been seen since. They don't like it when you point out this shit happens.
Many of you know that I defend much of mainstream climate science, including climate modeling as an enterprise. Where I depart of the “mainstream” is how much warming has occurred, how much future warming can be expected, and what should be done about it from an energy policy perspective.
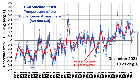
From the information provided by Google about my violations, in terms of the number of ads served, by far the most frequented web pages here at drroyspencer.com with “unreliable and harmful claims” are our (UAH) monthly global temperature update pages. This is obviously because some activists employed by Google (who are probably weren’t even born when John Christy and I received both NASA and American Meteorological Society awards for our work) don’t like the answer our 43-year long satellite dataset gives. Nevermind that our dataset remains one of the central global temperature datasets used by mainstream climate researchers in their work.
I still do not understand what exactly is the left objecting, the graph itself is what most people know, or at least I've not heard anyone to contest it. There is a 0.7 degrees increase in the last 43 years, I remember being under 1 in the last 100 and the globohomo want to build back better in order to limit to 1.5.
The graph itself does not contradict anything that the left is saying. The left does say that if we reach 1.5 then we are all going to die or something ridiculous like that.
I actually pulled the climate data in my region not that long ago, as part of a discussion with my father. The data I had went back over a hundred years. The conclusion we came to is that it is getting slightly warmer over time, but far less than projected by the "Climate Scientists"
This is mostly because of an unusually cool period in the 50s and 60s. If you go back further it was really only a little warmer than it was in the early 30s. I'm wondering how much my data would fall in line with his.
The founding of Jamestown nearly ended in complete failure because of drought the likes of which have never been seen since. They don't like it when you point out this shit happens.
Is there anything behind this? What exactly was the harmful information?
I still do not understand what exactly is the left objecting, the graph itself is what most people know, or at least I've not heard anyone to contest it. There is a 0.7 degrees increase in the last 43 years, I remember being under 1 in the last 100 and the globohomo want to build back better in order to limit to 1.5.
The graph itself does not contradict anything that the left is saying. The left does say that if we reach 1.5 then we are all going to die or something ridiculous like that.
Googled didn't demonetize a graph. They demonetize a website. On the website they disagreed with the mainstream views of:
It didn't follow the narrative?