3 A new (lower) normal... (media.kotakuinaction2.win) posted 1 year ago by TheImpossible1 1 year ago by TheImpossible1 +12 / -9 4 comments download share 4 comments share download save hide report block hide replies
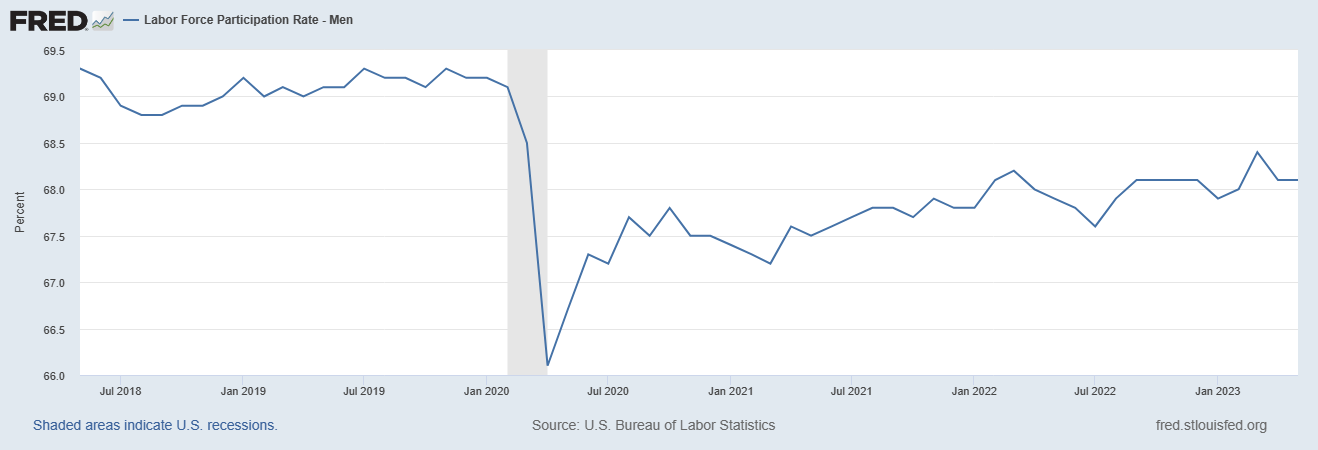
now look at 2008
and since the 60s.
By profession.
Oh, that chart is horrendous, but I'm focusing in on the last five years because of ESG.
OK, what does this mean? Can you now compare it to the participation rate of women?
Have those female CEOs firing 99% male workers that you predicted arrived yet?